Pregnancy can make time feel strangely different. One week you are counting days, the next you are staring at an ultrasound screen hoping to see that tiny heartbeat, and suddenly every number seems to carry a mountain of meaning.
For many people, especially after a previous loss, a Miscarriage Probability Chart can feel like a small island of certainty in an ocean of questions.
It can help explain how the probability of miscarriage generally changes as pregnancy progresses, though it can never predict exactly what will happen to one individual pregnancy.
A miscarriage, also called spontaneous pregnancy loss, is unfortunately common. The American College of Obstetricians and Gynecologists (American College of Obstetricians and Gynecologists) notes that early pregnancy loss occurs in about 10% of clinically recognized pregnancies, while the Royal
College of Obstetricians and Gynaecologists (Royal College of Obstetricians and Gynaecologists) gives a broader patient-facing estimate of about one in five pregnancies after a positive pregnancy test. The difference reminds us that percentages depend on exactly which pregnancies are being counted.
The important thing is this: a chart is a guide, not a verdict. As gestational age increases and a pregnancy demonstrates normal pregnancy progress, the overall chance of loss
generally falls. Still, individual circumstances matter, and sometimes the numbers simply cannot tell the whole story.
| Pregnancy stage | Approx. miscarriage risk |
|---|---|
| Before 5 weeks | ~10–20%* |
| 5 weeks | ~10–15% |
| 6 weeks | ~5–10% |
| 7 weeks | ~3–7% |
| 8 weeks | ~2–5% |
| 9 weeks | ~1–3% |
| 10 weeks | ~1–2% |
| 11–12 weeks | <1–2% |
| After 12 weeks | Generally <1% |
Miscarriage Probability Chart by Gestational Week
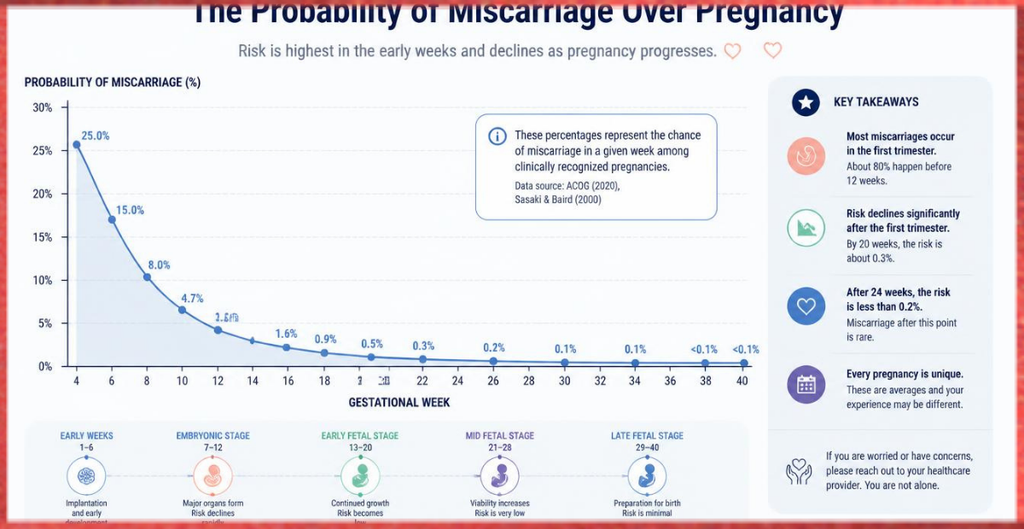
A useful way to read a miscarriage probability chart is to think about changing risk rather than one fixed percentage. Very early pregnancy contains more uncertainty because some pregnancies end before they can even be confirmed clinically.
| Gestational age | General pattern of miscarriage risk | What it means |
|---|---|---|
| 3 weeks | Very early and relatively uncertain | Pregnancy may be around implantation or just beyond it, so estimates are difficult to individualize. |
| 4 weeks | Risk begins to become measurable | A positive pregnancy test may confirm pregnancy, but ultrasound findings can still be limited. |
| 5 weeks | Risk remains higher than later weeks | Early development is underway, though dating may still be uncertain. |
| 6 weeks | Risk generally begins falling with reassuring findings | Ultrasound may provide more information about location and development. |
| 7 weeks | Generally lower than the earliest weeks | A normally developing embryo and appropriate cardiac activity can provide reassuring evidence. |
| 8 weeks | Generally continues to decline | Ongoing normal development is an encouraging sign. |
| 9 weeks | Lower than earlier pregnancy | The pregnancy has passed another important developmental stage. |
| 10 weeks | Generally declining | Individual risk still depends on age, history, symptoms, and clinical findings. |
| 11 weeks | Generally lower | Most early losses occur during the first trimester. |
| 12 weeks | Lower than at the beginning of pregnancy | Reaching the end of the first trimester is an important milestone. |
| 13 weeks | Generally much lower than very early pregnancy | Risk continues to depend on individual circumstances and pregnancy findings. |
| 14 weeks | Lower overall early-loss risk | The pattern is different from the first several weeks. |
| 15 weeks | Generally low compared with early pregnancy | Later pregnancy losses have different causes and terminology. |
| 16 weeks | Generally lower | Clinical monitoring becomes increasingly important for other pregnancy concerns too. |
| 17 weeks | Lower miscarriage probability than early pregnancy | A pregnancy progressing normally is increasingly reassuring. |
| 18 weeks | Relatively low early-loss risk | Pregnancy is well beyond the period when most early miscarriages occur. |
| 19 weeks | Low compared with early gestation | A loss at this stage requires clinical assessment and may be classified differently depending on the definition used. |
| 20 weeks | Important terminology boundary | Definitions of miscarriage, stillbirth, and fetal death vary by country and organization. |
This table shows the miscarriage risk by week as a general trend rather than pretending that every person has the same probability percentage.
ACOG states that approximately 80% of early pregnancy losses occur during the first trimester, which helps explain why the overall risk changes so much during those first weeks.
Miscarriage Probability Chart: Probability of Not Miscarrying
People often search for the probability of not miscarrying because it can be emotionally easier to understand than a risk number.
If a study reports a 10% risk in a particular population, the corresponding simple complement would be 90% not experiencing that outcome. But that calculation only works when the underlying percentage applies to the exact same population and time period.
In other words, a chance of not miscarrying is not a promise that a pregnancy will continue. It is simply the other side of a statistical estimate. Pregnancy is not a stopwatch, and the body does not read the chart before deciding what happens next, which is why these numbers should be treated gently.
The reassuring part is that pregnancy progress usually changes the picture. A pregnancy that continues to develop normally through successive gestational weeks has already passed some of the points at which early losses commonly occur. Yet no chart can reduce the risk to zero.
Miscarriage Probability by Week After a Heartbeat
One of the most searched topics is miscarriage risk after heartbeat. Seeing cardiac activity during an early ultrasound is generally reassuring because it demonstrates that the embryo is developing and has reached a stage where cardiac activity can be observed.
Research has found that the presence of fetal cardiac activity is associated with a lower risk of spontaneous abortion than general early-pregnancy rates, although the exact risk differs according to factors such as gestational age, vaginal bleeding, and maternal age.
This is why a heartbeat and miscarriage risk discussion should not be reduced to a single percentage. A heartbeat at one gestational age is not exactly the same statistical situation as a heartbeat several weeks later. A clinician also considers the ultrasound measurements, symptoms, pregnancy history, and whether the dating is reliable.
What Affects Miscarriage Risk?
Statistics become more meaningful when we understand what goes into the miscarriage risk model. Research has identified several factors that can influence risk, although having one of these factors does not mean a miscarriage will happen.
Maternal Age
Maternal age and miscarriage risk are strongly associated in clinical research. ACOG reports that clinically recognized early pregnancy loss increases with age, with substantially higher rates reported after age 35 and especially after age 40.
Age is not a destiny number, obviously. Many people in their late 30s and 40s have healthy pregnancies, while pregnancy loss can also occur in younger people.
Previous Miscarriages
Previous miscarriages can influence the estimated probability of another loss. This is one reason a personalized miscarriage risk calculator may ask about pregnancy history instead of relying only on gestational age.
At the same time, one miscarriage does not mean that future pregnancies are destined to end the same way. RCOG notes that most miscarriages are one-off events and that many people go on to have successful pregnancies.
Previous Live Births
A person’s previous live births may also be included in research models because reproductive history can provide useful statistical information. Researchers often examine parity and previous outcomes alongside age and other characteristics rather than treating each variable as an isolated number.
Maternal Height, Weight, and BMI
Some models consider maternal height, maternal weight, pre-pregnancy weight, and BMI. These variables can help researchers investigate associations between body composition and pregnancy outcomes.
But this does not mean a BMI number can tell someone whether they will miscarry. A maternal BMI is one statistical variable among many, and individual medical circumstances are much more complicated than a calculator field.
Why Gestational Age Matters So Much
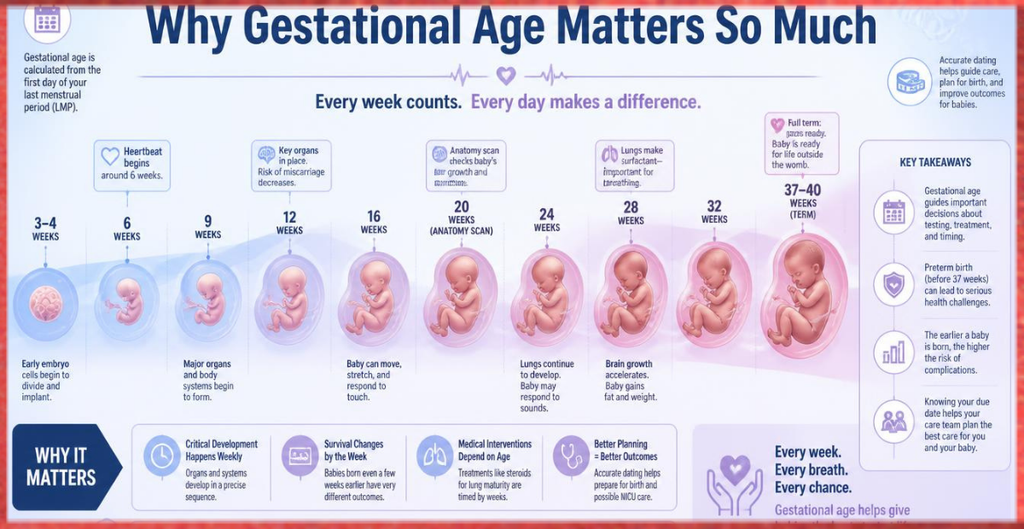
Gestational age usually refers to how far along the pregnancy is, conventionally measured from the first day of the last menstrual period (LMP).
Because ovulation does not necessarily occur on exactly the same day for everyone, LMP-based dating can sometimes differ from actual embryonic development.
That is where a dating ultrasound becomes useful. An early ultrasound can help clinicians establish or refine pregnancy dating and assess whether the pregnancy appears to be developing appropriately. When gestational age is uncertain, a percentage taken from a chart may be much less meaningful than it appears.
For people using a pregnancy week calculator or gestational age calculator, remember that a calculated week is an estimate. Ovulation, implantation, cycle length, and ultrasound measurements can all affect how the dates line up.
First Trimester Miscarriage Risk
The first trimester miscarriage risk is higher than the risk later in pregnancy. ACOG reports that approximately 80% of early pregnancy losses occur during the first trimester.
This is also why people often search for miscarriage risk by week, miscarriage probability by week, and first trimester miscarriage risk together. They are trying to understand a moving target: as pregnancy develops normally, the statistical background risk generally falls.
A first-trimester ultrasound may provide important information about the pregnancy’s location, growth, and cardiac activity. Still, an ultrasound is not merely a “risk score.” It is a clinical examination that needs to be interpreted alongside symptoms and pregnancy dates.
Missed Miscarriage, Silent Miscarriage, and Delayed Miscarriage
Not every miscarriage announces itself with dramatic symptoms. A missed miscarriage, sometimes described informally as a silent miscarriage or asymptomatic miscarriage, can occur when the pregnancy has stopped developing but the body has not immediately expelled the pregnancy tissue.
ACOG explains that some people may have no obvious symptoms, and ultrasound may be needed to determine whether a pregnancy is continuing to develop.
This is one reason a person should not try to diagnose a miscarriage simply by checking whether symptoms have disappeared. Pregnancy symptoms can naturally change, and the absence of nausea or breast tenderness does not by itself establish pregnancy loss.
Miscarriage Before 20 Weeks and Stillbirth
The phrase miscarriage before 20 weeks appears frequently online, but terminology varies internationally. ACOG uses early pregnancy loss for loss within the first 13 completed weeks, while other organizations use different gestational-age boundaries for miscarriage and stillbirth.
This makes searches such as stillbirth vs miscarriage, fetal death before 20 weeks, and pregnancy loss before 20 weeks surprisingly confusing. The definitions matter when reading statistics because two studies can use different thresholds and therefore report different rates.
A fetal death later in pregnancy is medically and emotionally different from an early miscarriage, even though both involve devastating pregnancy loss. RCOG describes stillbirth as a baby’s death after 24 weeks of pregnancy in its UK patient guidance.
How Miscarriage Studies Create Probability Percentages

A published probability model does not simply guess a number. Researchers collect pregnancy data, define their outcome, identify relevant variables, and use a statistical model to examine relationships.
Depending on the research question, investigators may use a prospective cohort study, case-control study, life table analysis, or another design.
A systematic review or meta-analysis can combine evidence from multiple studies, although differences between studies still need careful interpretation.
Important details include the study methodology, characteristics of the study participants, demographics, gestational age, how miscarriage was defined, and which confounding variables were considered. A percentage from one study is therefore not automatically the correct percentage for every pregnant person.
Some miscarriage prediction projects have explored factors including age, previous pregnancy losses, height, weight, smoking, alcohol intake, and folic-acid use.
More recent research also demonstrates how investigators may incorporate age, BMI, previous live births, previous miscarriages, and other variables into statistical analyses.
Why There Is No Perfect Miscarriage Calculator
A miscarriage calculator, miscarriage risk calculator, or pregnancy risk calculator can be useful for understanding research, but it should not be mistaken for a diagnostic tool.
A calculator might estimate daily miscarriage risk, weekly miscarriage risk, or cumulative miscarriage risk, depending on its design. The trouble is that pregnancy outcomes are influenced by variables that a simple online form cannot fully capture.
For example, two people may both be 8 weeks pregnant, but one may have a reassuring ultrasound with appropriate growth while the other may have bleeding and uncertain dating. Their clinical situations are not identical, even though the calculator sees “8 weeks.”
That distinction is easy to miss when staring at a neat miscarriage probability table. Numbers look wonderfully precise on a screen. Real life, annoyingly, is not so tidy.
Understanding Cumulative Probability
Cumulative probability means the combined chance of an event occurring over a defined period rather than on one particular day or week.
For example, a weekly risk and a cumulative risk are not interchangeable. If a study says the risk during one period is X%, that does not mean you can simply add X% repeatedly for every week. Statistical models account for how people move through time and whether an outcome has already occurred.
This is why a cumulative miscarriage risk figure should always be read with its definition and time frame. A research paper may calculate risk from a positive pregnancy test, from clinical recognition, or from a particular ultrasound-confirmed gestational age.
Common Misconceptions About Miscarriage Risk
One common misunderstanding is that stress, ordinary activity, or having sex automatically causes miscarriage. RCOG states that there is no evidence that stress causes miscarriage and that sex during pregnancy is not associated with early miscarriage.
Another misconception is that spotting automatically means pregnancy loss. Bleeding can occur during early pregnancy without resulting in miscarriage, although bleeding should still be discussed with a healthcare professional because it can also signal miscarriage or ectopic pregnancy.
And perhaps the hardest misconception of all is the idea that a miscarriage is something the pregnant person caused. Many early miscarriages result from chromosomal problems in the embryo, and often there is nothing the person could have done to prevent the loss.
When to Seek Medical Care

A chart should never replace medical assessment. If you experience vaginal bleeding, cramping, fluid leakage, or other concerning symptoms during pregnancy, contact your obstetrician, midwife, doctor, or appropriate pregnancy-care service.
Heavy bleeding, severe abdominal pain, shoulder pain, dizziness, fainting, or feeling very unwell require urgent medical attention because these symptoms can sometimes indicate a serious complication such as ectopic pregnancy.
An ultrasound may be used to assess pregnancy development, and blood tests such as β-hCG may sometimes be needed. Importantly, ACOG notes that one ultrasound or one blood test is not always enough to establish a diagnosis in every situation.
How to Use a Miscarriage Probability Chart Responsibly
A helpful way to use a Miscarriage Probability Chart is to ask three questions:
- What population did these miscarriage statistics come from?
- At what point in pregnancy was the risk measured?
- Does the study include factors relevant to my own pregnancy?
Look for peer-reviewed papers, clearly described study populations, transparent methodology, and reputable medical organizations. Be cautious with websites that present a single dramatic probability percentage as though it applies equally to every pregnancy.
A chart can explain population-level patterns. Your healthcare professional can interpret your actual pregnancy.
A Gentle Perspective on Pregnancy Progress
Pregnancy can feel like a series of gates: the positive test, 5 weeks, 6 weeks, the first ultrasound, the heartbeat, 8 weeks, 12 weeks, and then the next milestone.
Each one can bring relief, but also a new thing to worry about. That’s a very human response, especially for anyone who has experienced pregnancy loss before.
The statistics do show an encouraging broad pattern: early miscarriage is common, but the risk generally decreases as a normally developing pregnancy progresses.
ACOG and RCOG both emphasize that miscarriage is common and that most people who experience one will not necessarily experience repeated losses.
So if you are reading a chart late at night, refreshing the page again and again, take the number as information rather than prophecy. It can explain a trend; it cannot see your future.
Frequently Asked Question
miscarriage rates by week
Miscarriage rates by week generally decrease as a pregnancy progresses, with the highest risk occurring during the early weeks and first trimester.
chance of miscarriage by week
The chance of miscarriage by week usually becomes lower as gestational age increases, especially when pregnancy development and ultrasound findings are reassuring.
miscarriage risk by week
Miscarriage risk by week varies according to gestational age, maternal age, pregnancy history, and other individual risk factors.
risk of miscarriage by week
The risk of miscarriage by week is generally highest in early pregnancy and gradually declines as the pregnancy continues normally.
miscarriage rate by week
The miscarriage rate by week represents a population-level estimate and should not be treated as an exact prediction for an individual pregnancy.
Read this blog https://avenzum.com/timer-until-4pm/
Final Thoughts on the Miscarriage Probability Chart
The Miscarriage Probability Chart is most useful when it helps people understand how miscarriage risk by week, gestational age and miscarriage risk, and pregnancy progression are connected. It is less useful when a person treats one percentage as a personal prediction.
From 3 weeks through 20 weeks, the statistical landscape changes considerably, but there is no single universal percentage for every gestational week. Maternal age, pregnancy history, ultrasound findings, symptoms, dating accuracy, and the definitions used by researchers can all change the estimate.
If you have experienced a miscarriage, uncertainty can feel especially heavy. Be kind to yourself while you wait for answers. And if you are currently pregnant and worried about your risk, an obstetrician, midwife, or other qualified healthcare professional can interpret your individual situation far better than an online chart ever could.
Pregnancy statistics are numbers, but behind every number is a person hoping, waiting, and wondering. Sometimes the most useful thing a chart can offer is not certainty, but a clearer understanding of what the numbers actually mean.